Charts-Doughnut and Pie
[report 영역] Pie Chart와 Doughnut Chart
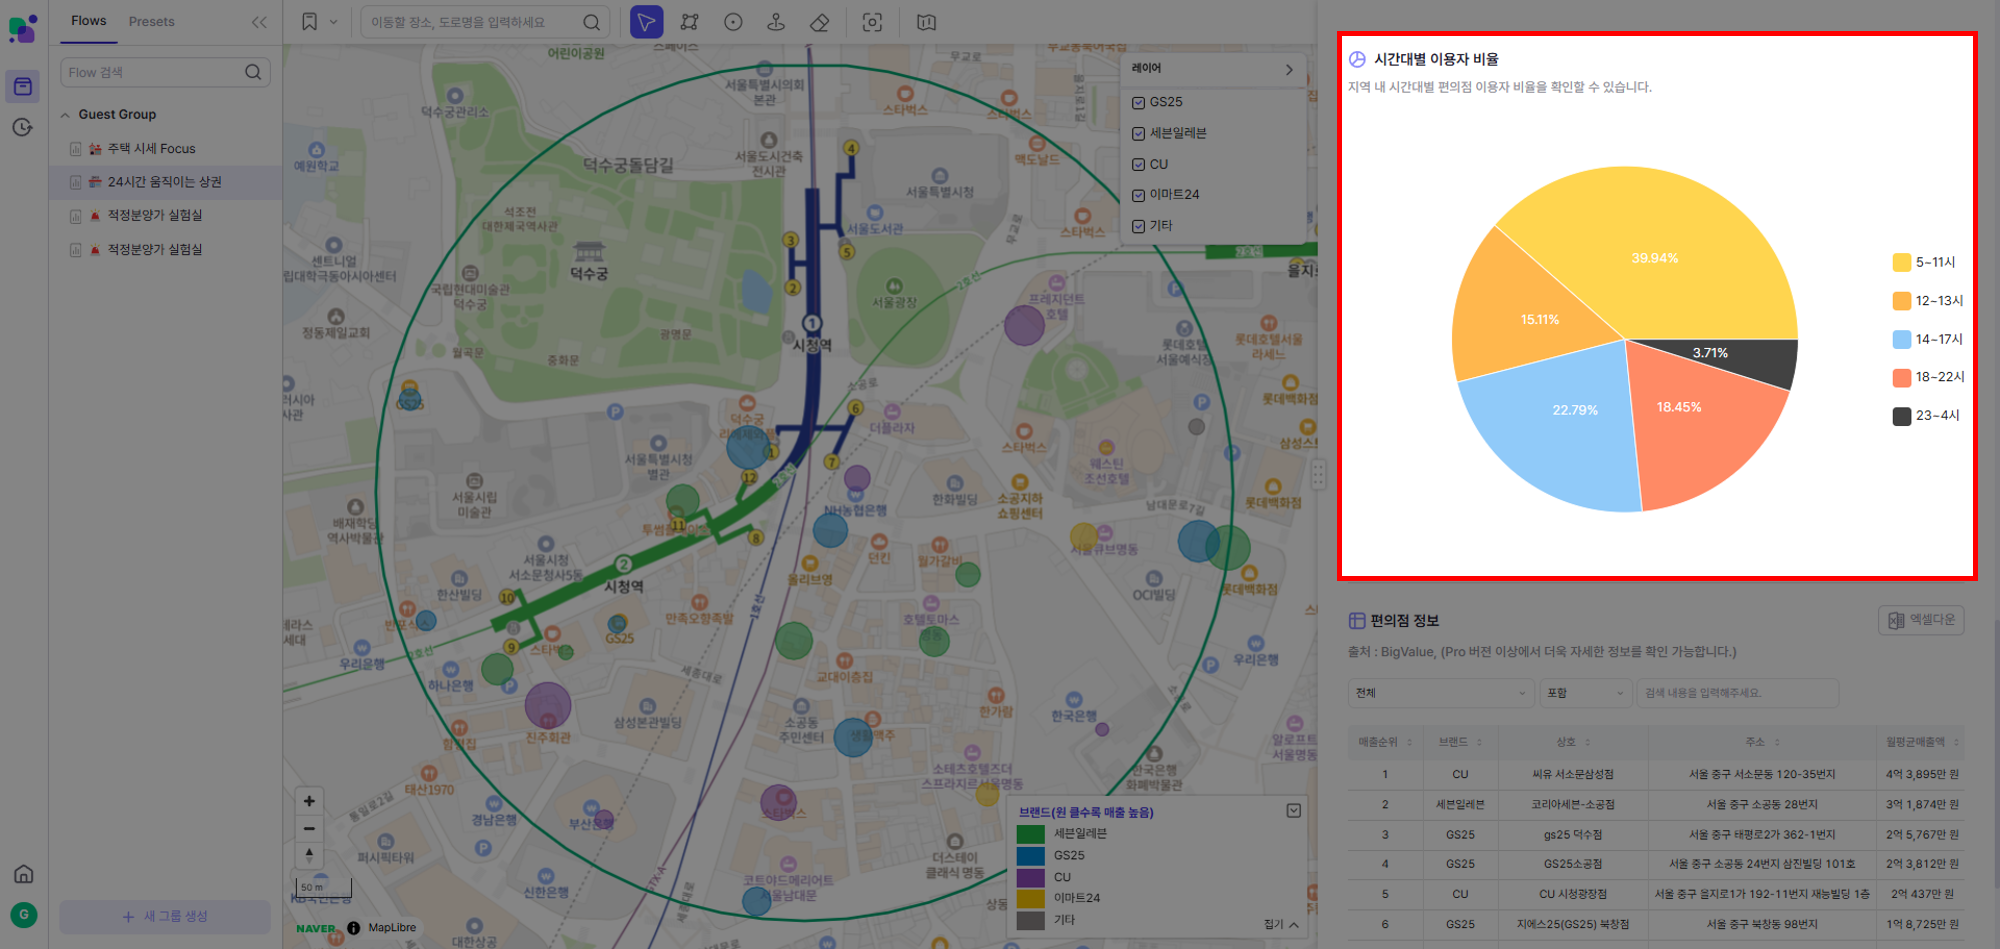
Pie Chart
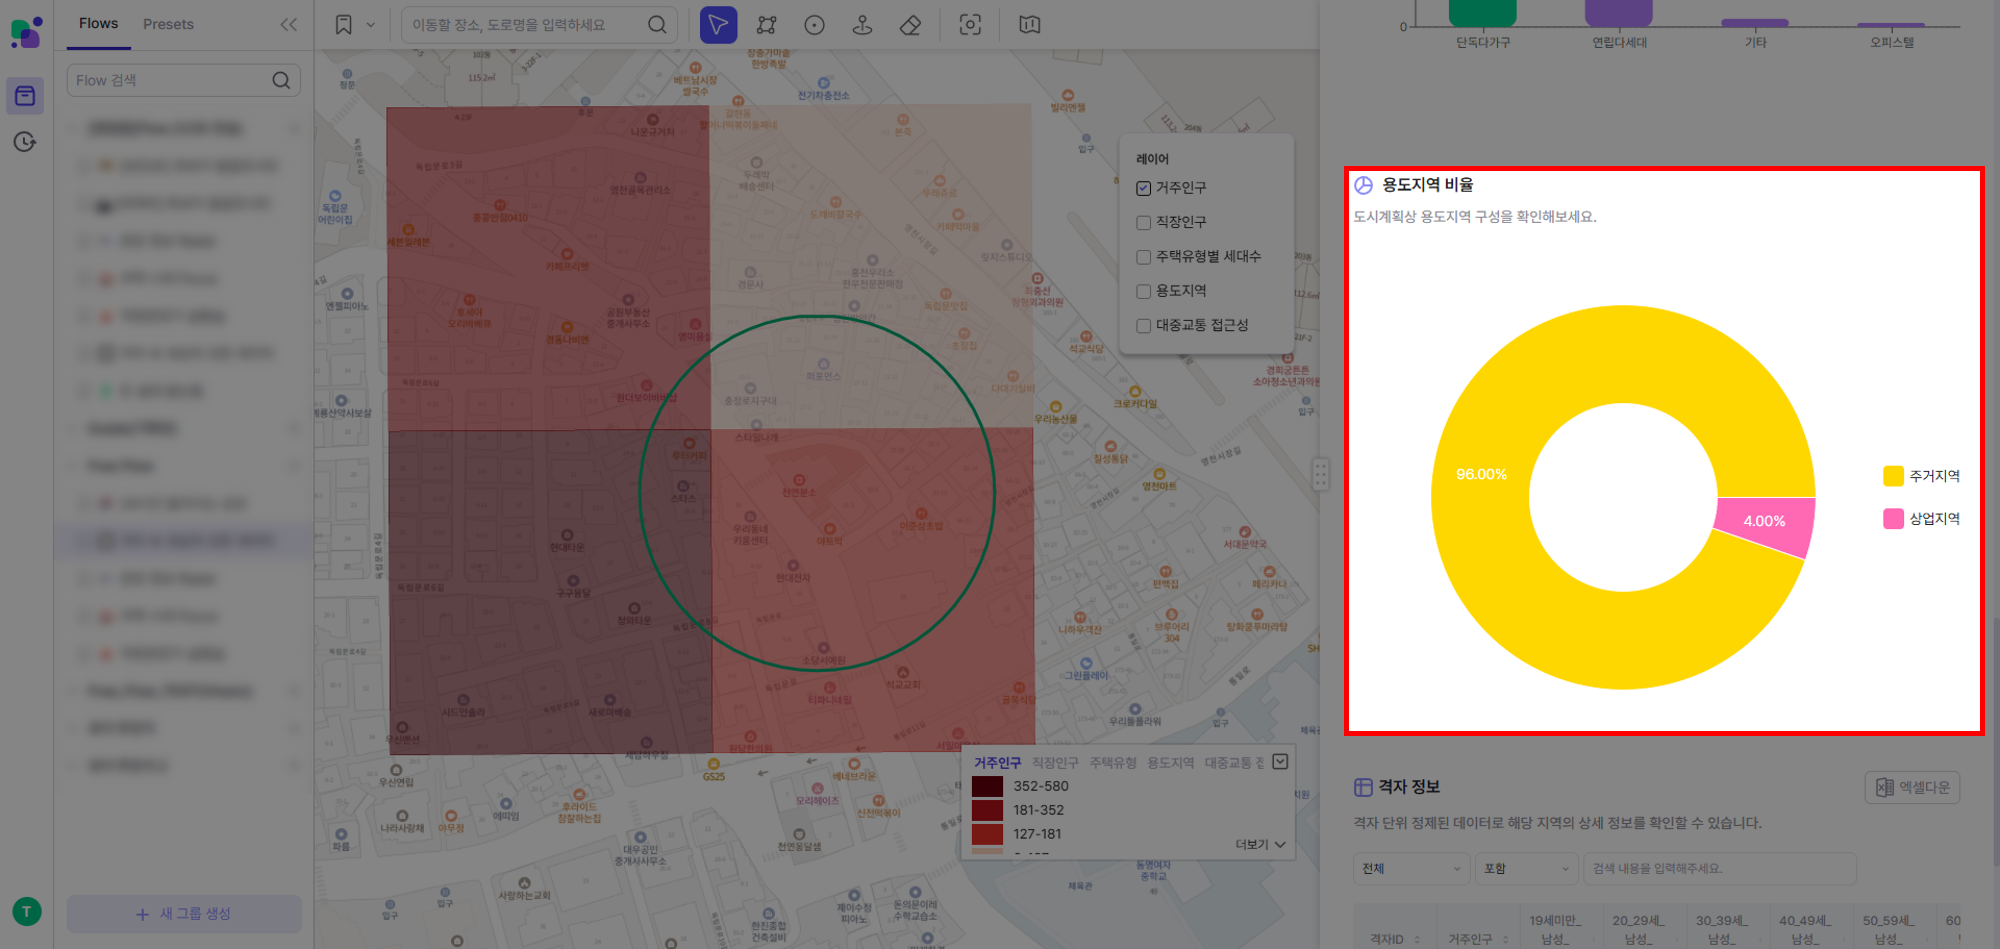
 Doughnut Chart
| 필드 | 타입 | 필수 | 설명 | 기본값 |
|---|---|---|---|---|
| section | string | Y | 데이터가 표출되는 영역 report | |
| contents | array | Y | 차트 데이터 | |
| config | object | Y | 기본 설정 | |
| config.id | string | Y | 차트 고유 식별자 | |
| config.type | string | Y | type 구분 | |
| config.dimensions | string[] | Y | 항목에 해당하는 컬럼명 | |
| config.measures | string[] | Y | 값에 해당하는 컬럼명 | |
| config.option | object | N | 세부 설정 | |
| config.option.chartType | string | Y | 차트 유형 pie | |
| config.option.style | object | N | 차트 스타일 설정 | |
| config.option.style.layout | enum | N | 차트 레이아웃 horizontal,vertical | vertical |
| config.option.style.title | object | N | 제목 스타일 설정 | |
| config.option.style.title.text | string | N | 차트 제목 텍스트 | |
| config.option.style.title.color | string | N | 제목 색상 | |
| config.option.style.title.fontSize | int | N | 제목 글자 크기 | |
| config.option.style.title.fontWeight | int | N | 제목 글자 굵기 | |
| config.option.style.xAxis | object | Y | X축 설정 | |
| config.option.style.xAxis.type | enum | N | x축의 type설정 category,number | number |
| config.option.style.xAxis.angle | int | N | X축 글자 각도 | 0 |
| config.option.style.xAxis.fontSize | int | N | X축 글자 크기 | 12 |
| config.option.style.yAxis | object | N | Y축 설정 | |
| config.option.style.yAxis.angle | int | N | Y축 글자 각도 | 0 |
| config.option.style.yAxis.fontSize | int | N | Y축 글자 크기 | 12 |
| config.option.style.yAxis.min | int | N | Y축의 최소 값 | 0 |
| config.option.style.yAxis.max | int | N | Y축의 최대 값 | 100 |
| config.option.style.legend | object | N | 범례 설정 | |
| config.option.style.legend.layout | enum | N | 범례 레이아웃 horizontal,vertical | horizontal |
| config.option.style.legend.align | enum | N | 범례 정렬 left,center,right | center |
| config.option.style.legend.verticalAlign | enum | N | 범례 수직 정렬 top,middle,bottom | bottom |
| config.optiostyle.tooltip | object | N | 툴팁 설정 | |
| config.option.style.tooltip.labelFontsize | int | N | 툴팁 레이블 글자 크기 | 10 |
| config.option.style.tooltip.contentFontsize | int | N | 툴팁 내용 글자 크기 | 12 |
| config.option.style.column | object[] | N | 컬럼 설정 | |
| config.option.style.column[].name | string | N | 컬럼명 | |
| config.option.style.column[].fillColor | string | N | 컬럼 색상 적용 우선 순위 1.contents[].fillColor 2.option.style.column.fillColor 3.기본 색상 | 정해진 컬러 세트에서 순서대로 색이 정해짐 |
| config.option.style.cell | object[] | N | 셀 설정 | |
| config.option.style.cell[].key | object[] | N | 목표 셀의 키 ex) 단지명 | |
| config.option.style.cell[].value | object[] | N | 목표 셀의 값 ex) (일반)브라운스톤남산 | |
| config.option.style.cell[].fillColor | object[] | N | 셀 배경색 | |
| config.option.style.pie | object | N | pie chart 스타일 설정 | |
| config.option.style.pie.minAngle | int | N | 조각 최소 각도 | 5 |
| config.option.style.pie.innerRadius | int | N | 안쪽 원의 반지름 | 90 |
| config.option.style.pie.outerRadius | int | N | 바깥 원의 반지름 | 185 |
Protocol 구조
{
    section: "report",
    contents:[{ key: value }],
    config: {
    id: string,
    type: string,
    dimensions: string[],
    measures: string[],
    option: {
        type: 'pie' ,
        style: {
            layout: 'horizontal' | 'vertical',
            title: {
                text: string,
                color: string,
                fontSize: int,
                fontWeight: int,
                note:string;
            },
            xAxis: {
                type:'category'|'number'
                angle: int,
                fontSize: int,
            },
            yAxis: {
                angle: int,
                fontSize: int,
                min:int,
                max:int
            },
            legend: {
                layout: 'horizontal' | 'vertical',
                align: 'left' | 'center' | 'right',
                verticalAlign: 'top' | 'middle' | 'bottom',
            },
            tooltip: {
                labelFontsize: int,
                contentFontsize: int,
            },
            column: [{
                name: string,
                fillColor: string,
            }],
            cell: [{
                    key:string,
                    value:string,
                    fillColor:string
                }],
            pie: {
                minAngle: int,
                outerRadius: int
            }
        }
    }}
}
Example
 {
  "section":"report",
  "contents": [
    {
      "용도지역": "주거지역",
      "비율": 99.45,
    },
    {
      "용도지역": "녹지지역",
      "비율": 0.55,
    }
  ],
  "config": {
    "id": "lup_chart",
    "type": "chart",
    "dimensions": ["용도지역"],
    "measures": ["비율"],
    "option": {
      "type": "pie",
      "style": {
        "layout": "horizontal",
        "title": {
          "text": "용도지역 비율",
          "note": "도시계획상 용도지역 구성을 확인할 수 있습니다.",
          "fontSize": 16,
          "fontWeight": 600
        },
        "xAxis": {
          "fontSize": 12,
          "angle": 0
        },
        "yAxis": {
           "fontSize": 12
        },
        "legend": {
          "layout": "horizontal",
          "align": "center",
          "verticalAlign": "bottom"
        },
        "tooltip": {
          "labelFontsize": 14,
          "contentFontsize": 14
        },
        "column":[{
          "name": "비율",
          "fillColor": "#4085BE"
        }],
        "cell":[
            {
                "key":"용도지역",
                "value":"주거지역",
                "fillColor": "#FFD700"
            },
            {
                "key":"용도지역",
                "value":"녹지지역",
                "fillColor": "#32CD32"
            }
        ],
        "pie":{
                "minAngle": 5,
                "outerRadius": 185
        }
      }
    }
  }
}